CPU Performance Profiling
CPU Performance Profiling
Code profiling tools allow you to analyse the execution of your code during runtime and find any performance bottlenecks.
This tutorial will use the profiling tools in Microsoft Visual Studio, but there is lots of other software that does the same thing.
Instructions
Open up Microsoft Visual Studio.
Open up your gamemode in the game client or editor. The advantage of using the game client is that you avoid the overhead of the editor, which can make the execution analysis more accurate. Whether that matters much in practice though is debatable.
Go to
Debug->Attach to Process....
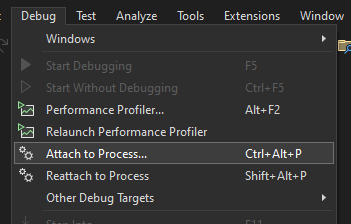
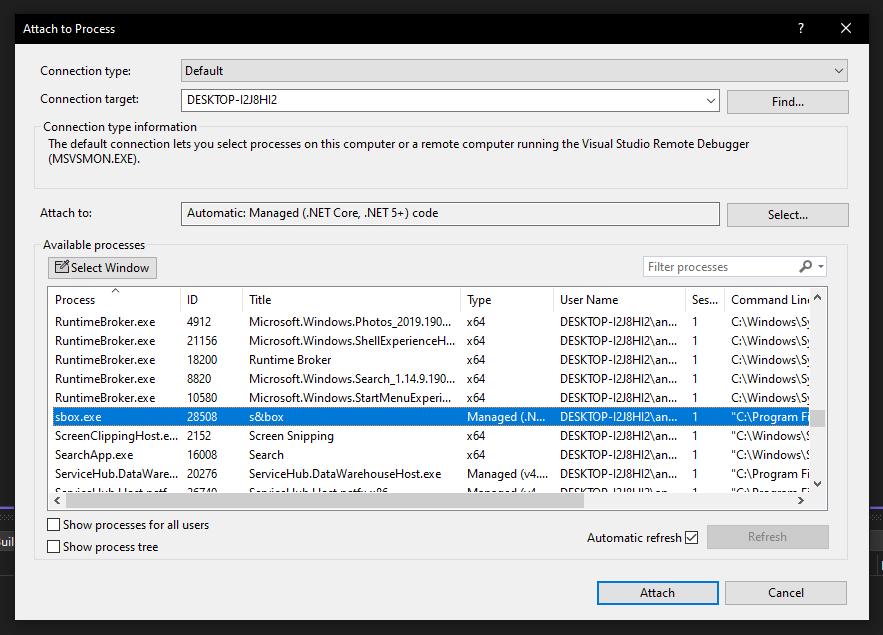
- Find sbox.exe or sbox-dev.exe in the process list and press
Attach.
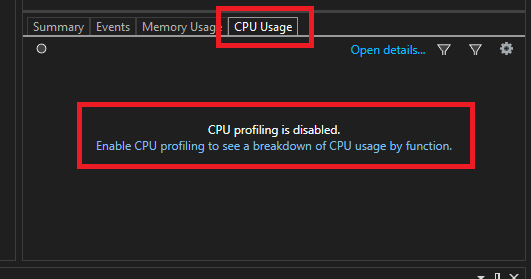
- In this menu that should pop up go to
CPU Usage. You'll also want to pressEnable CPU profiling to see a breakdown of CPU usage by function.
Go back to your gamemode and do random stuff for about a minute or so. The longer you profile it for, the more accurate your results will be (but anything over 60 seconds is probably overkill). If there's something in particular you want to benchmark, then just spam that over and over again in-game.
When you are done, break all.
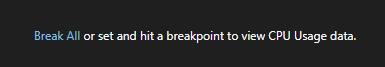
It will do some stuff, be patient. Your game will be frozen now.
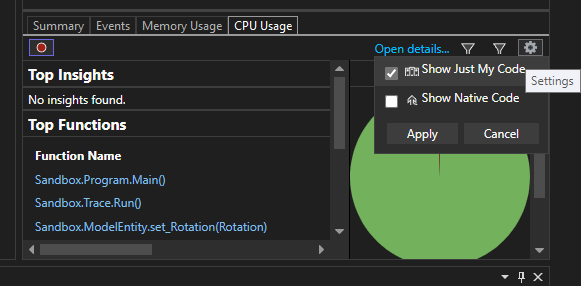
At this stage it can be a good idea to enable
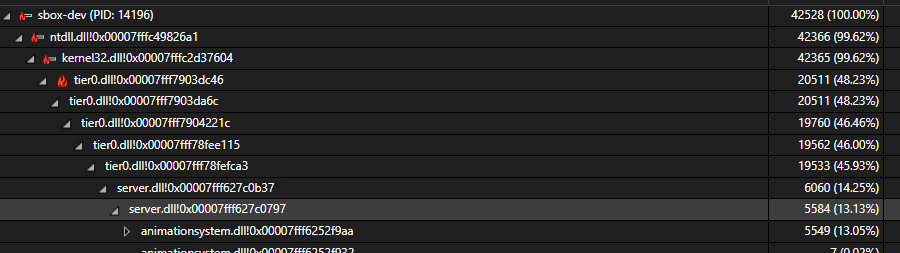
Show Native Codeand disableShow Just My Code. By default the execution analyser will only show you what's going on in your code in the C# side of the engine. This is because what goes on in the C++ part of the engine is somewhat a secret since Facepunch do not make the debugging information for this public. Naturally that's a big chunk of code that would otherwise be missed. Setting these options will show the analysis of the C++ code; it's mostly gibberish, since we don't get actual function names, but sometimes it can still produce helpful clues. For example, in the screenshot below we can see that the animation system is using up a whopping 13% of the CPU time. Having said all that, for the rest of the tutorial, we will keep these at their defaults though just to keep things simple.
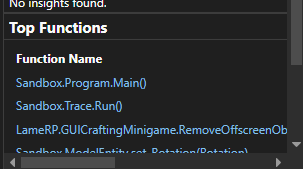
- Click on any of the functions that show up here, e.g.
Sandbox.Program.Main().
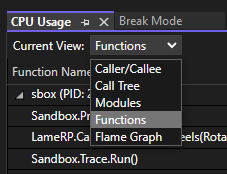
- Switch to
Call Treesince it is probably the nicest way to view what's going on.
- Find and expand
Sandbox.Program.Main().
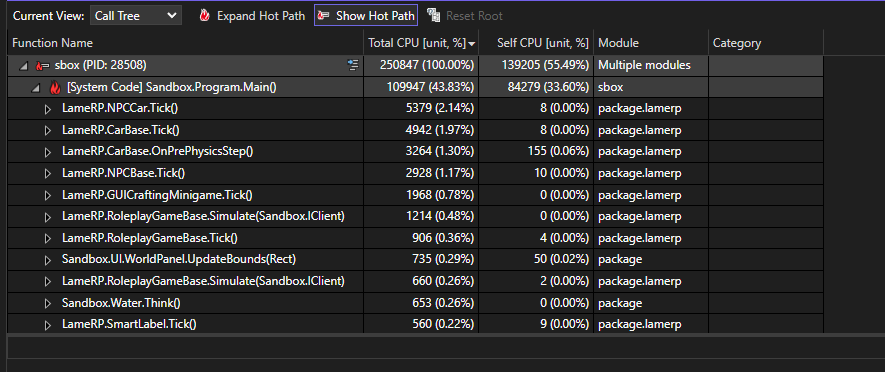
- This will basically show you the slowest functions that were called and how much total CPU time they took up. Main() is the starting point for your program, so that will always be high. However, we can see that NPCCar.Tick() is taking up 2.14% of our CPU time, which is quite a lot. We can navigate deeper into the tree to find out the cause.
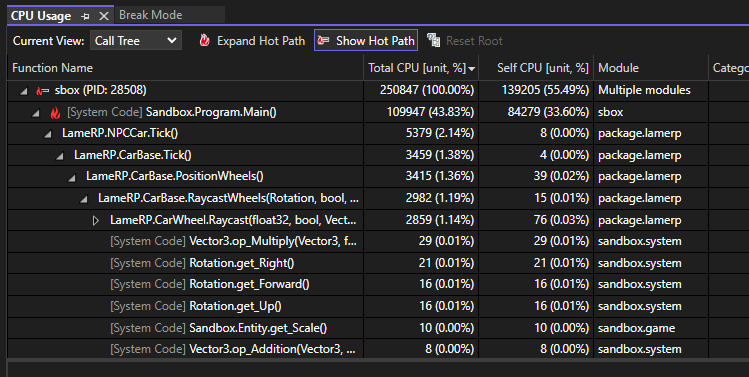
In this case the culprit was the function CarWheel.Raycast() making too many raycasts. Every car wheel is making a raycast every tick, and we have have 21 cars in the map, each with 4 wheels, totalling 5040 raycasts per second! Oops!
Press
ContinueorStop Debuggingto unfreeze the game.
 Garry's Mod
 Rust
Rust
 Steamworks
 Wiki Help
 S&box
S&box